- Innovation
- 30 June, 2022
- Trek Performance Research
Designing for speed The aerodynamics behind our fastest road race bike ever
Madone has been dedicated to speed since its inception. But as both bikes and bike racing get faster, it takes better technology than ever to stay ahead of the pack.
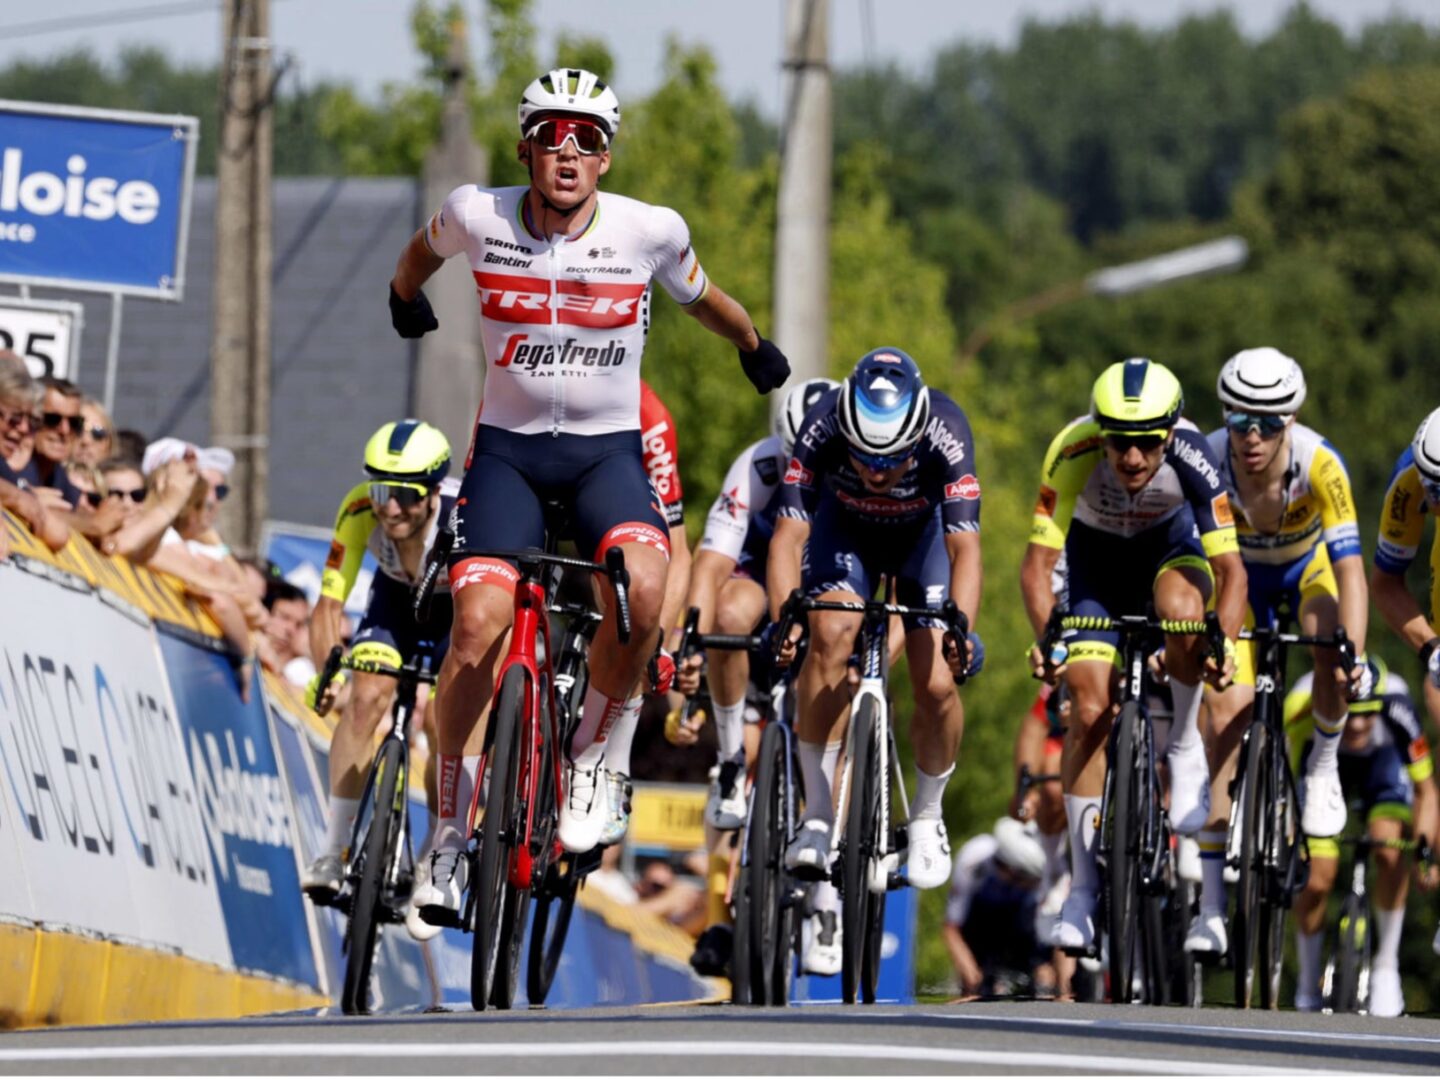
Since the first Madone was released in 2003, the average speed of pro riders racing the Spring Monuments has increased by roughly 1.5 km/h. That means a rider from twenty years ago would need to increase their power by more than 35 watts to race at today’s speeds, assuming their equipment hadn’t progressed to help make them faster. At these speeds, aerodynamic drag is responsible for almost 90% of resistive power, so improving aerodynamics is top of mind for anyone who wants to win.
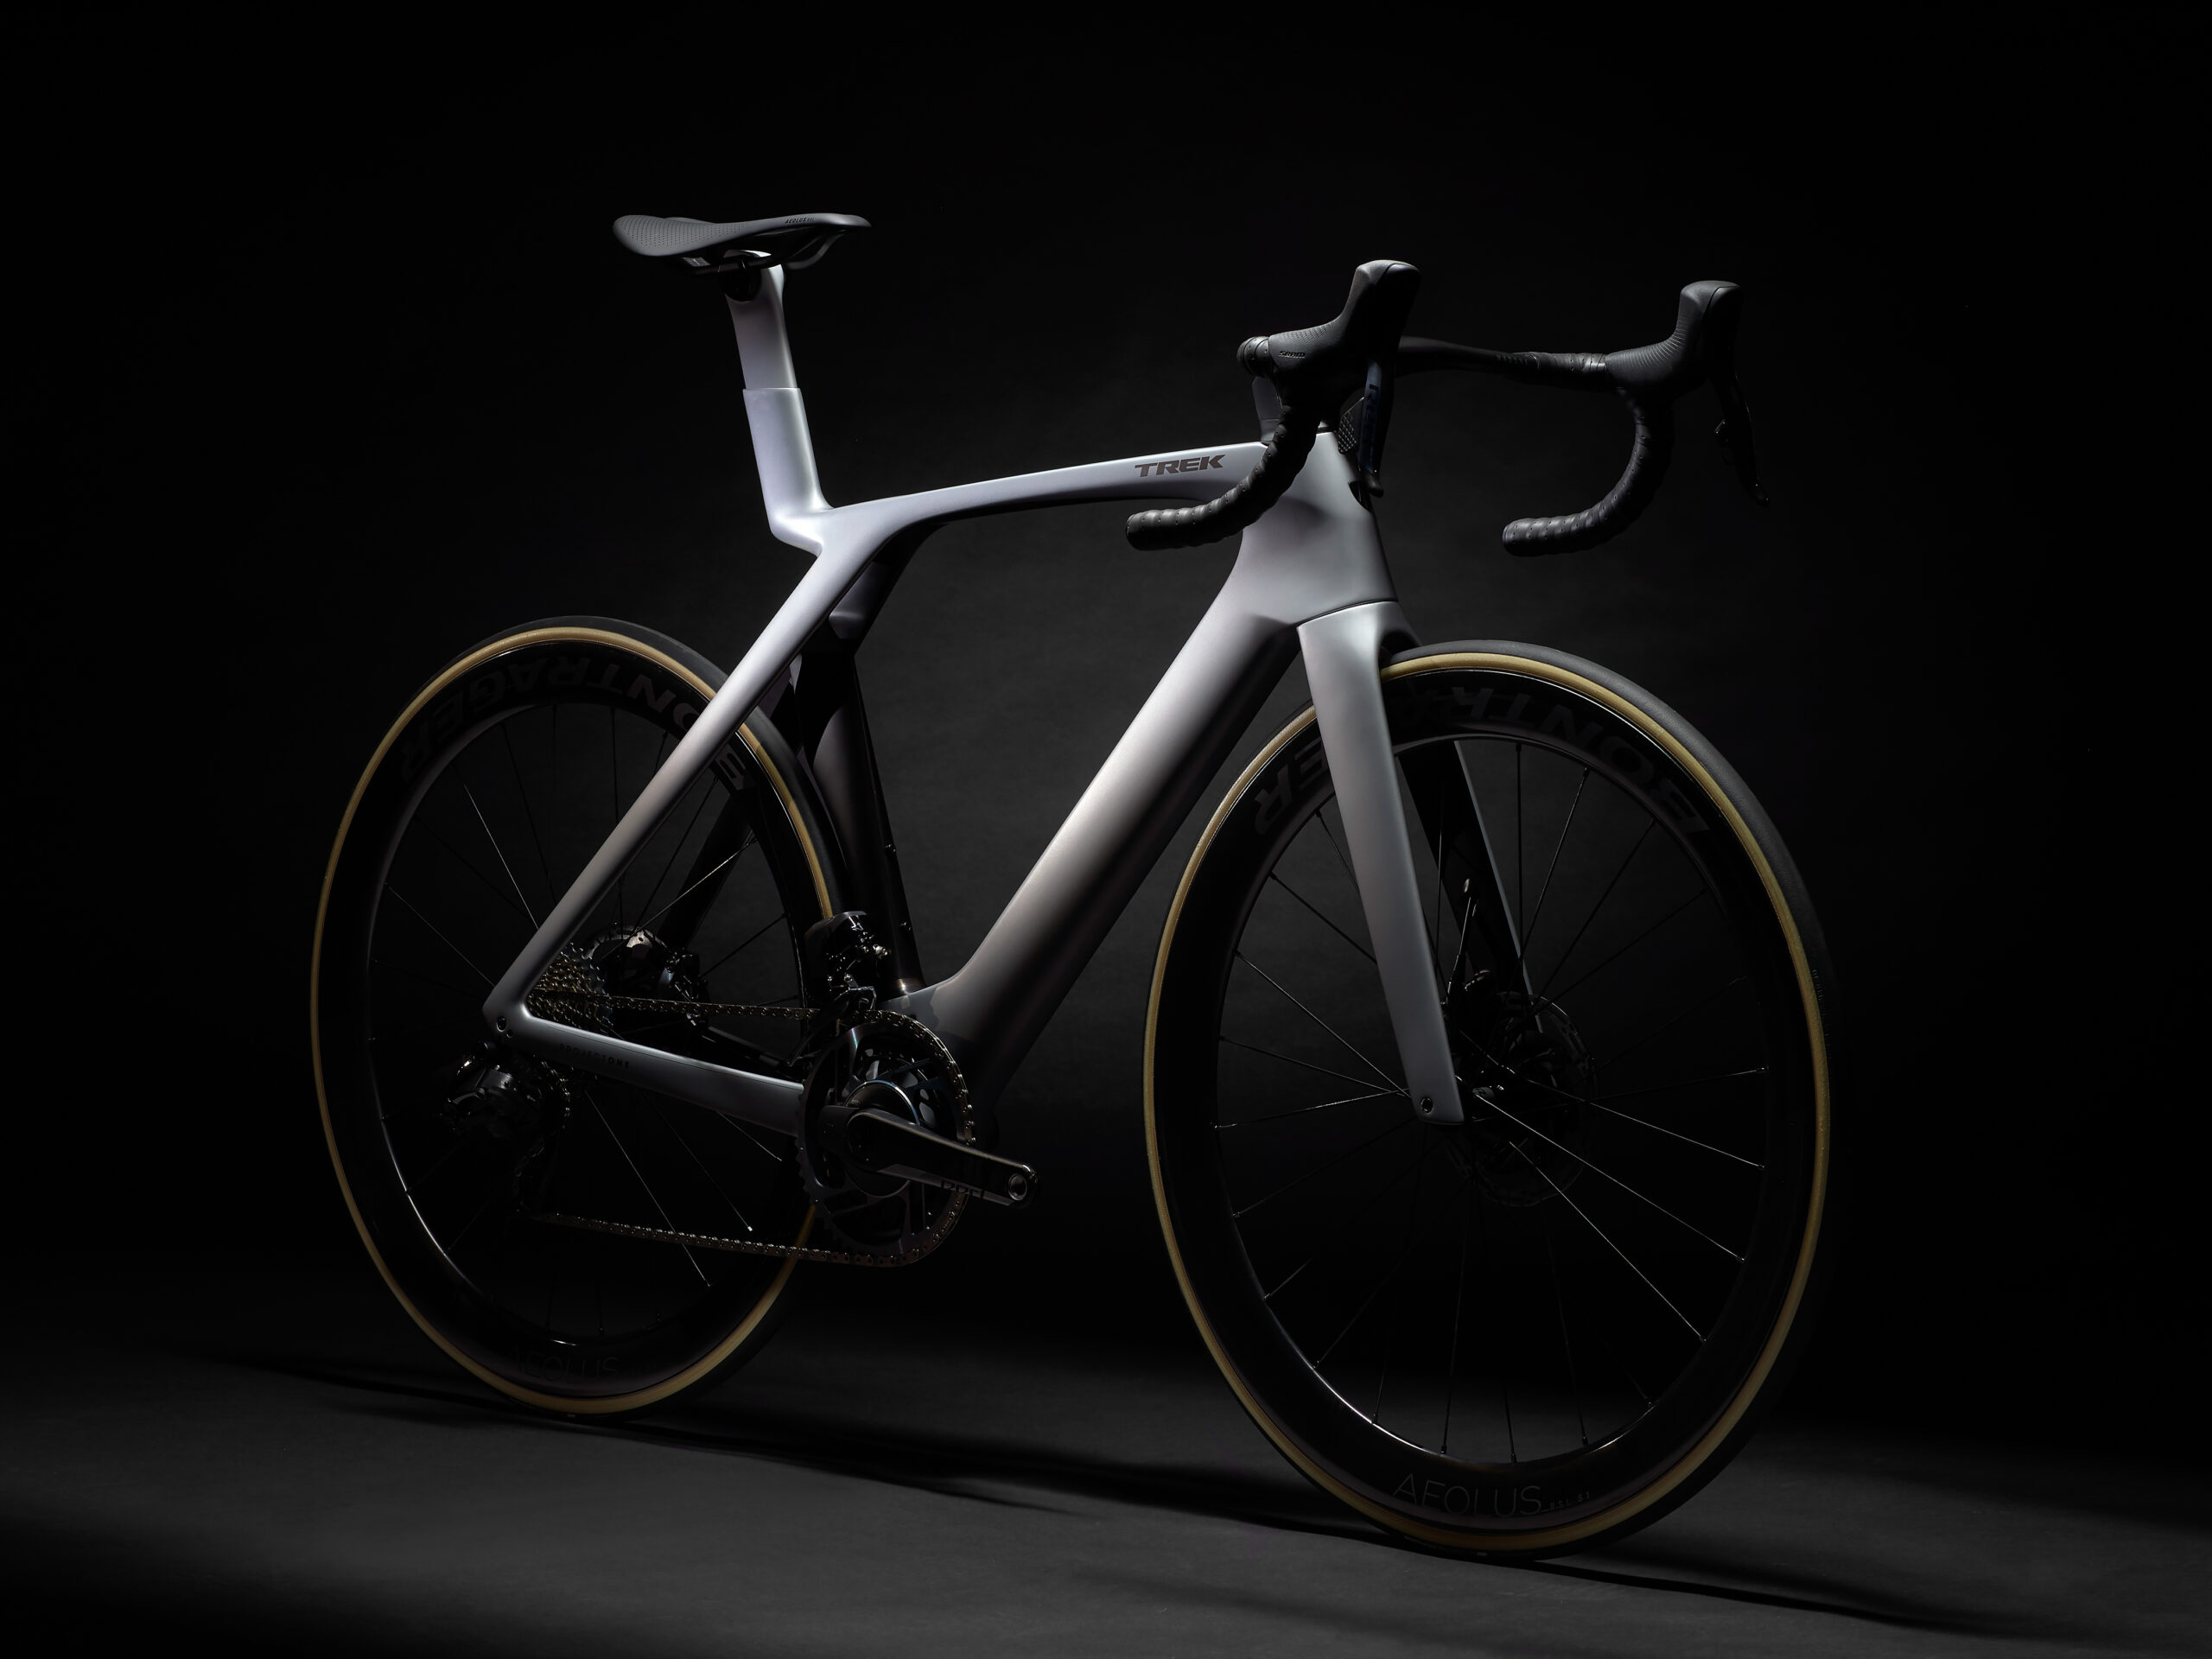
The all-new Madone is the next evolution of what a racing bike can be. Read on to learn the aerodynamics behind our fastest road race bike ever.
IsoFlow, total pressure, and frame drag
The most obvious change in the new Madone is the brand-new IsoFlow feature, which improves aerodynamics, weight, and rider comfort. But how does it reduce drag?
IsoFlow was first conceived by identifying higher-drag areas on the sixth generation Madone and studying the airflow in those spots. In the early stages of design, we do this using an airflow simulation software called computational fluid dynamics (CFD).
We often aren’t as concerned with modeling smaller components like bottle cages and spokes at this point in the design process. Instead, we’re focused on increasing simulation speed to iterate through more designs. The result is a simulation that relatively accurately models bulk airflow movement and can be solved in a matter of hours, rather than days, using our supercomputers. The one thing we never omit is the rider (although sometimes we hide them for visualization), which we include in CFD either dynamically pedaling or modeling a range of leg positions across the pedal cycle. We simulate thousands of conditions and prototypes in CFD to quickly study more designs than would ever be possible with wind tunnel or ride testing.
Below is an illustration of early-stage CFD on the previous generation Madone compared to an IsoFlow concept bike. Here, we visualize high-drag areas as “clouds” where red represents the most drag being produced. In this instance, the rider is hidden from view to allow us to better see what the airflow is doing on the frame. This illustration clearly shows how drag hotspots are cleaned up by the inclusion of new IsoFlow.
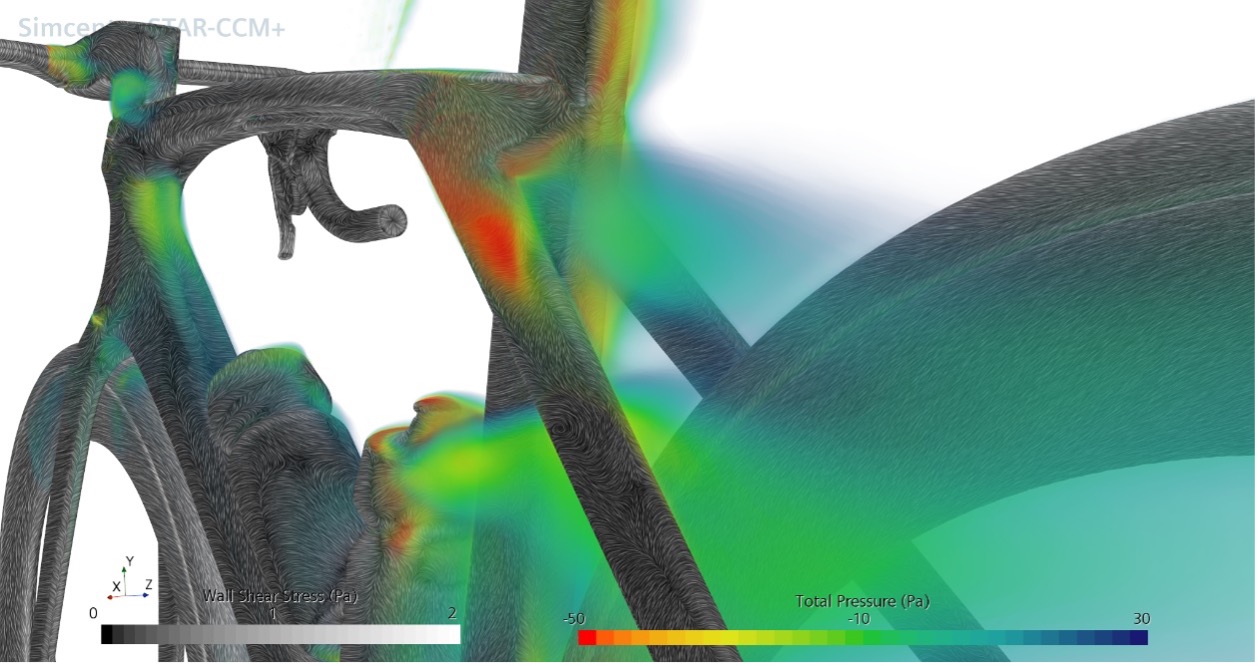
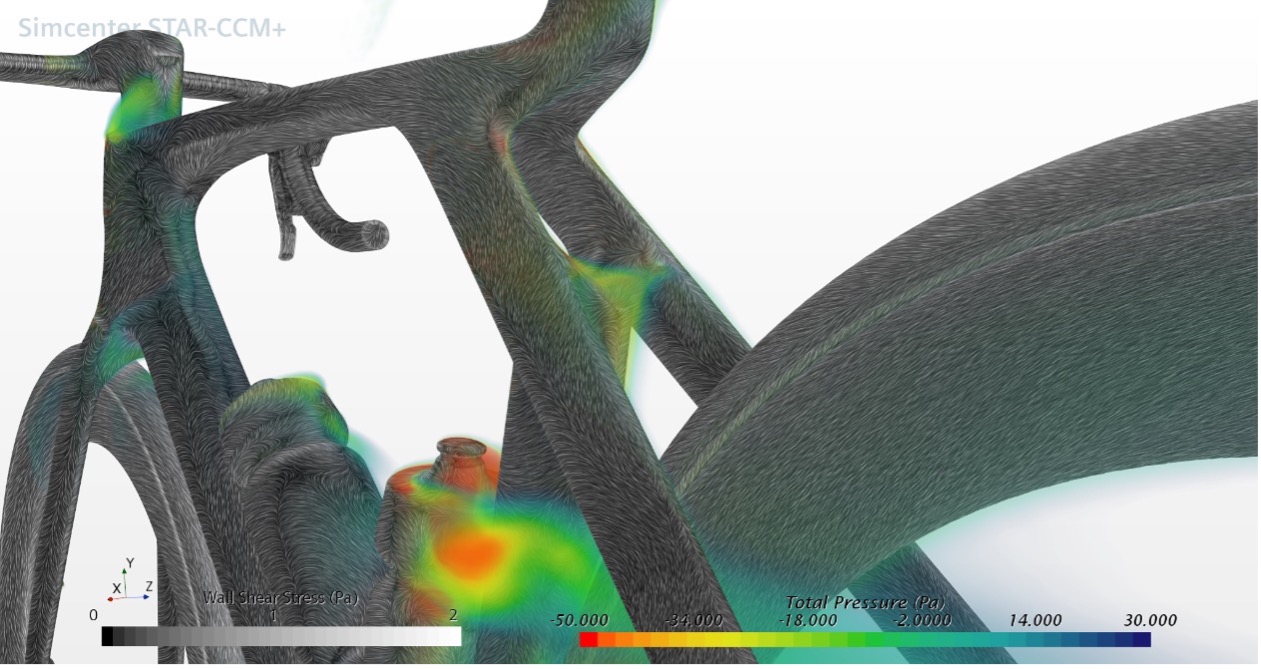
While the red clouds are a proxy for drag, what they really represent is “total pressure.” Without diving too deep into aerodynamic concepts, you can think about total pressure as a measure of energy in the flow. We want to avoid areas of low total pressure (or low energy) because they cause drag. Depending on how interesting your physics teacher was, you may remember learning about conservation of energy. It applies here – if energy is being removed from the airflow, it is coming from somewhere. In this case, that somewhere is your legs!
In Madone SLR’s new design, IsoFlow is able to increase the energy of the flow around and through the seat stay cluster by providing a clear path for airflow. This improves upon the traditional design in which air must squeeze around the seat tube and seat stays, causing it to interact with your moving legs and in turn increase drag.
IsoFlow and rider drag
IsoFlow does more than just reduce drag on the frame. The fast-moving air that travels through IsoFlow helps add energy to the area where the most drag of all is generated – behind and below the rider. As you pedal, counter-rotating vortices are formed as air tries to negotiate all the twists and turns it needs to travel around your back and legs. This effect is documented in some well-respected university studies, and we can see it in our CFD as well. In the animation below, the counter-rotating vortices are colored by the magnitude and direction of their rotation to differentiate the two.
Most of the drag on the bike-rider system comes from the rider, and much of it stems from this very effect. IsoFlow helps direct air into this low-pressure area and reduce the drag the rider creates. The effect is small, but any small change to the huge amount of drag a rider generates can often be more impactful than reductions to frame drag. The animation below shows the rider vortices again, but this time colored by total pressure and highlighting the streamlines through IsoFlow that move up to add energy to the rider wake.
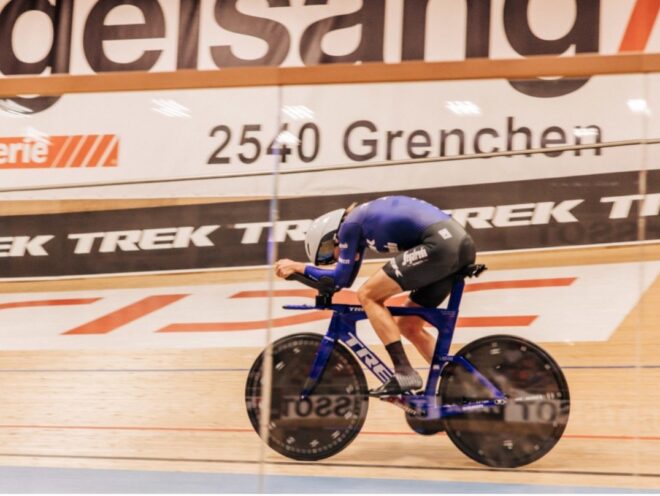
When it matters most, riders use aerodynamic components like disc wheels that still give a boost, even in “dirty air.”
Dealing with “dirty air”
Located at the back of the bike and surrounded by “dirty air,” you may wonder if features like IsoFlow can have much potential for aerodynamic improvement. It’s true – dirty air – the turbulent air near the back of the bike caused by rotating wheels and pedaling legs – introduces a real challenge. But a bike’s predominant airflow can still be influenced to reduce drag.
Formula 1 cars have aerodynamic features from the front to the back of the car to optimize airflow, even though dirty air becomes more of a problem as the air moves along the car. On bikes, the benefit of aerodynamic components when it comes to cutting through dirty air around the back of the bike has been proven many times across all racing disciplines – time trial, triathlon, track – through the use of rear aerodynamic disc wheels.
The effects of pedaling and “dirty air” can be studied more in the wind tunnel, which is where we bring our prototypes after our most promising concepts emerge from computational fluid dynamics. The wind tunnels we use are trusted by leading aerospace companies for their design and research for their ability to measure tiny changes in drag force and boast high-quality airflow.
Just like with CFD, we always test aerodynamics with a rider on the bike. After all – bikes don’t ride themselves. And the rider has an enormous impact on the aerodynamic qualities of a frame. But rider inclusion presents a problem. We’re often changing surfaces by mere millimeters between designs, so our results in the wind tunnel must be very repeatable to detect drag differences from model to model. Even the most experienced professional cyclists are not able to repeat their movements accurately enough for us to isolate a subtle effect from a single minor design change. So, what do we do?
Enter Manny the pedaling mannequin.
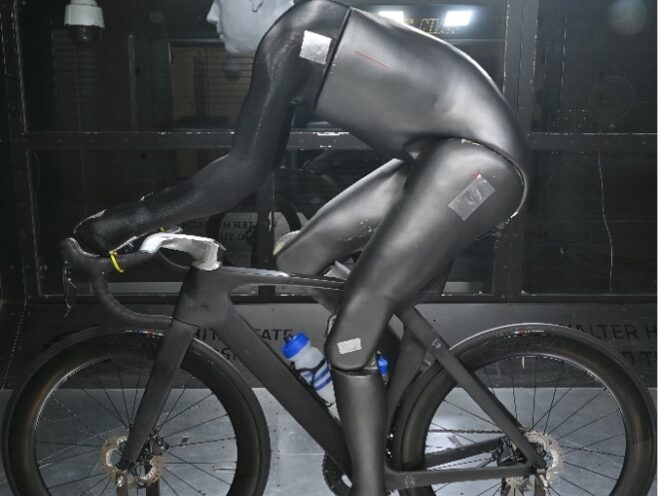
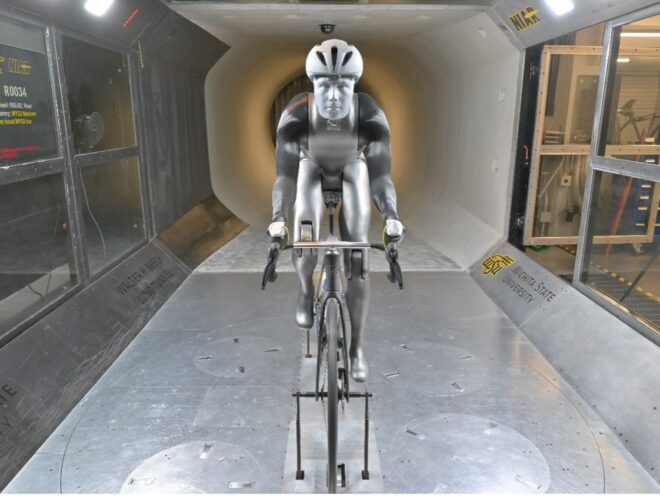
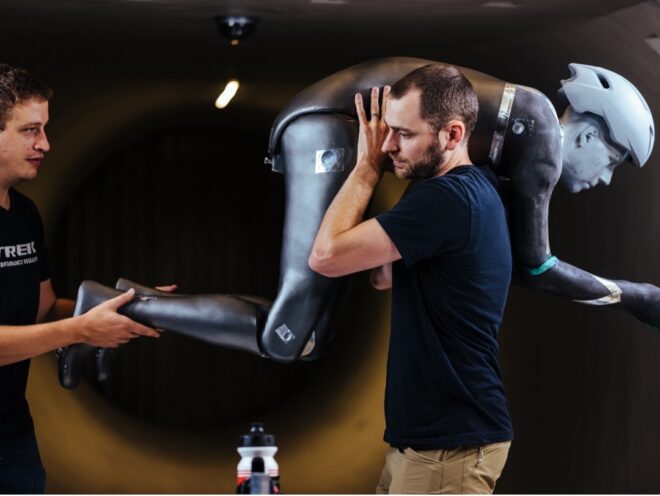
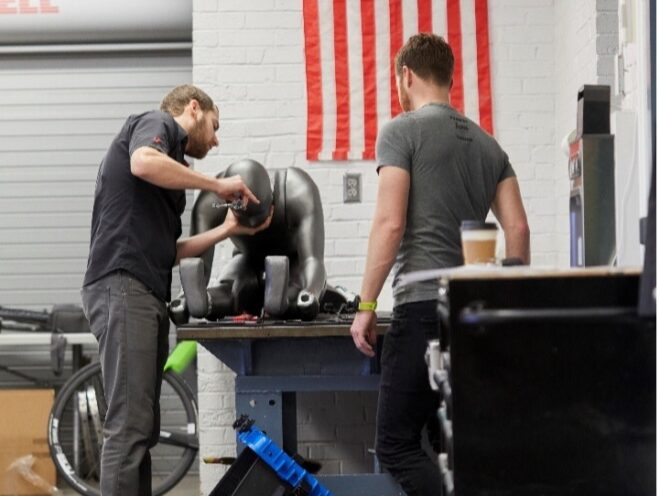
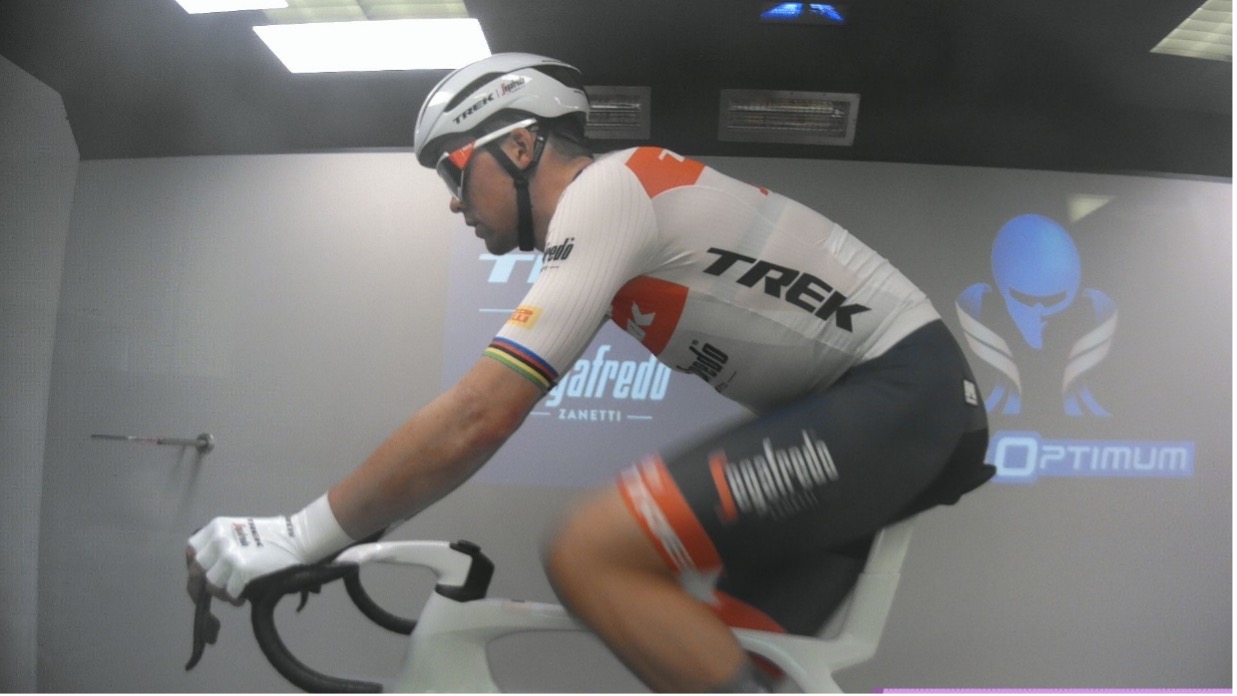
Manny combines the benefits of testing with a rider (including realistic aerodynamics and the ability to study effects of turbulence generated by the body and by pedaling) while avoiding the drawbacks of a human who can’t maintain perfect position (and who may complain after a long day of wind tunnel testing). With Manny, we can study design changes with a repeatability of about ±1 Watt at 45 km/h. We still conduct wind tunnel tests with live riders to verify our results and study equipment impact on specific Trek-Segafredo racers, but Manny is where the magic begins.
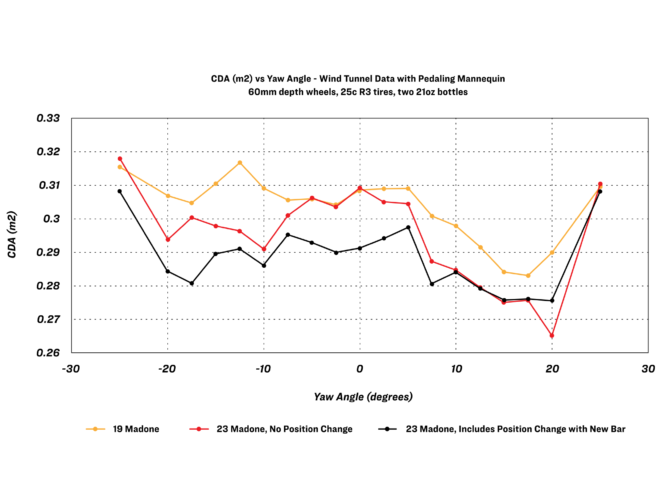
To make sure we get the same results test to test, we follow a specific wind tunnel testing protocol every time. Manny’s legs and the bike wheels both spin to mimic road conditions. Then, using a turntable, we rotate the whole setup across yaw angles (the angle wind hits you as you ride) from -25° to +25° to simulate crosswinds. These conditions represent most yaw angles a normal rider will experience. We do most testing at or near 45 km/h (for aero geeks, the exact speed changes test to test because we test at a constant Reynolds number), but we confirm our results at lower speeds as well. The result is a drag (measured in CDA) versus yaw sweep that looks like this:
This data shows that the drag improvements estimated in CFD were validated in the wind tunnel. With just a bike change from the previous generation to the new seventh generation Madone, the drag dramatically drops as the rider enters even minor crosswind conditions. In this scenario, the rider is in the exact same position when comparing the previous generation to the new bike.
However, if the rider uses the new Madone bar/stem and keeps their same bar size from the previous generations, their shifters are moved inboard 3 cm. The resulting aerodynamic position has an additional drag reduction at almost all yaw angles, especially low crosswind conditions.
If the rider wants to forgo a narrower arm position, they can either size up their new Madone bar/stem or use another bar solution. They will still see the improvements from the bike, but not the position change.
What does this mean for riders?
For a simpler way to compare bikes, we can average the drag across all yaw angles to get one drag number for each bike. However, a straight average is not representative of the real world, because you don’t encounter every yaw angle an equal amount of time. Instead, we must apply a weighted average that accounts for how often you see each angle or crosswind condition.
To do this, we calculated the theoretical percentage of time a rider will spend at each yaw angle across many rides and wind conditions using the Rayleigh wind distribution that approximates normal wind conditions on Earth. We then validated those calculations with data we collected during real-world rides with a wind sensor onboard the bike. The most common conditions are low crosswind – or low yaw angle – conditions (0° is the most common). No single ride will exactly match this yaw distribution, but the longer you ride, the closer you approach it over time.
Finally, to make the data more meaningful, the yaw-weighted drag is converted into power savings and time savings from the new bike. For example, the bike and position change combine for a 60 second time savings over an hour for a rider putting in the same effort relative to the previous generation Madone.

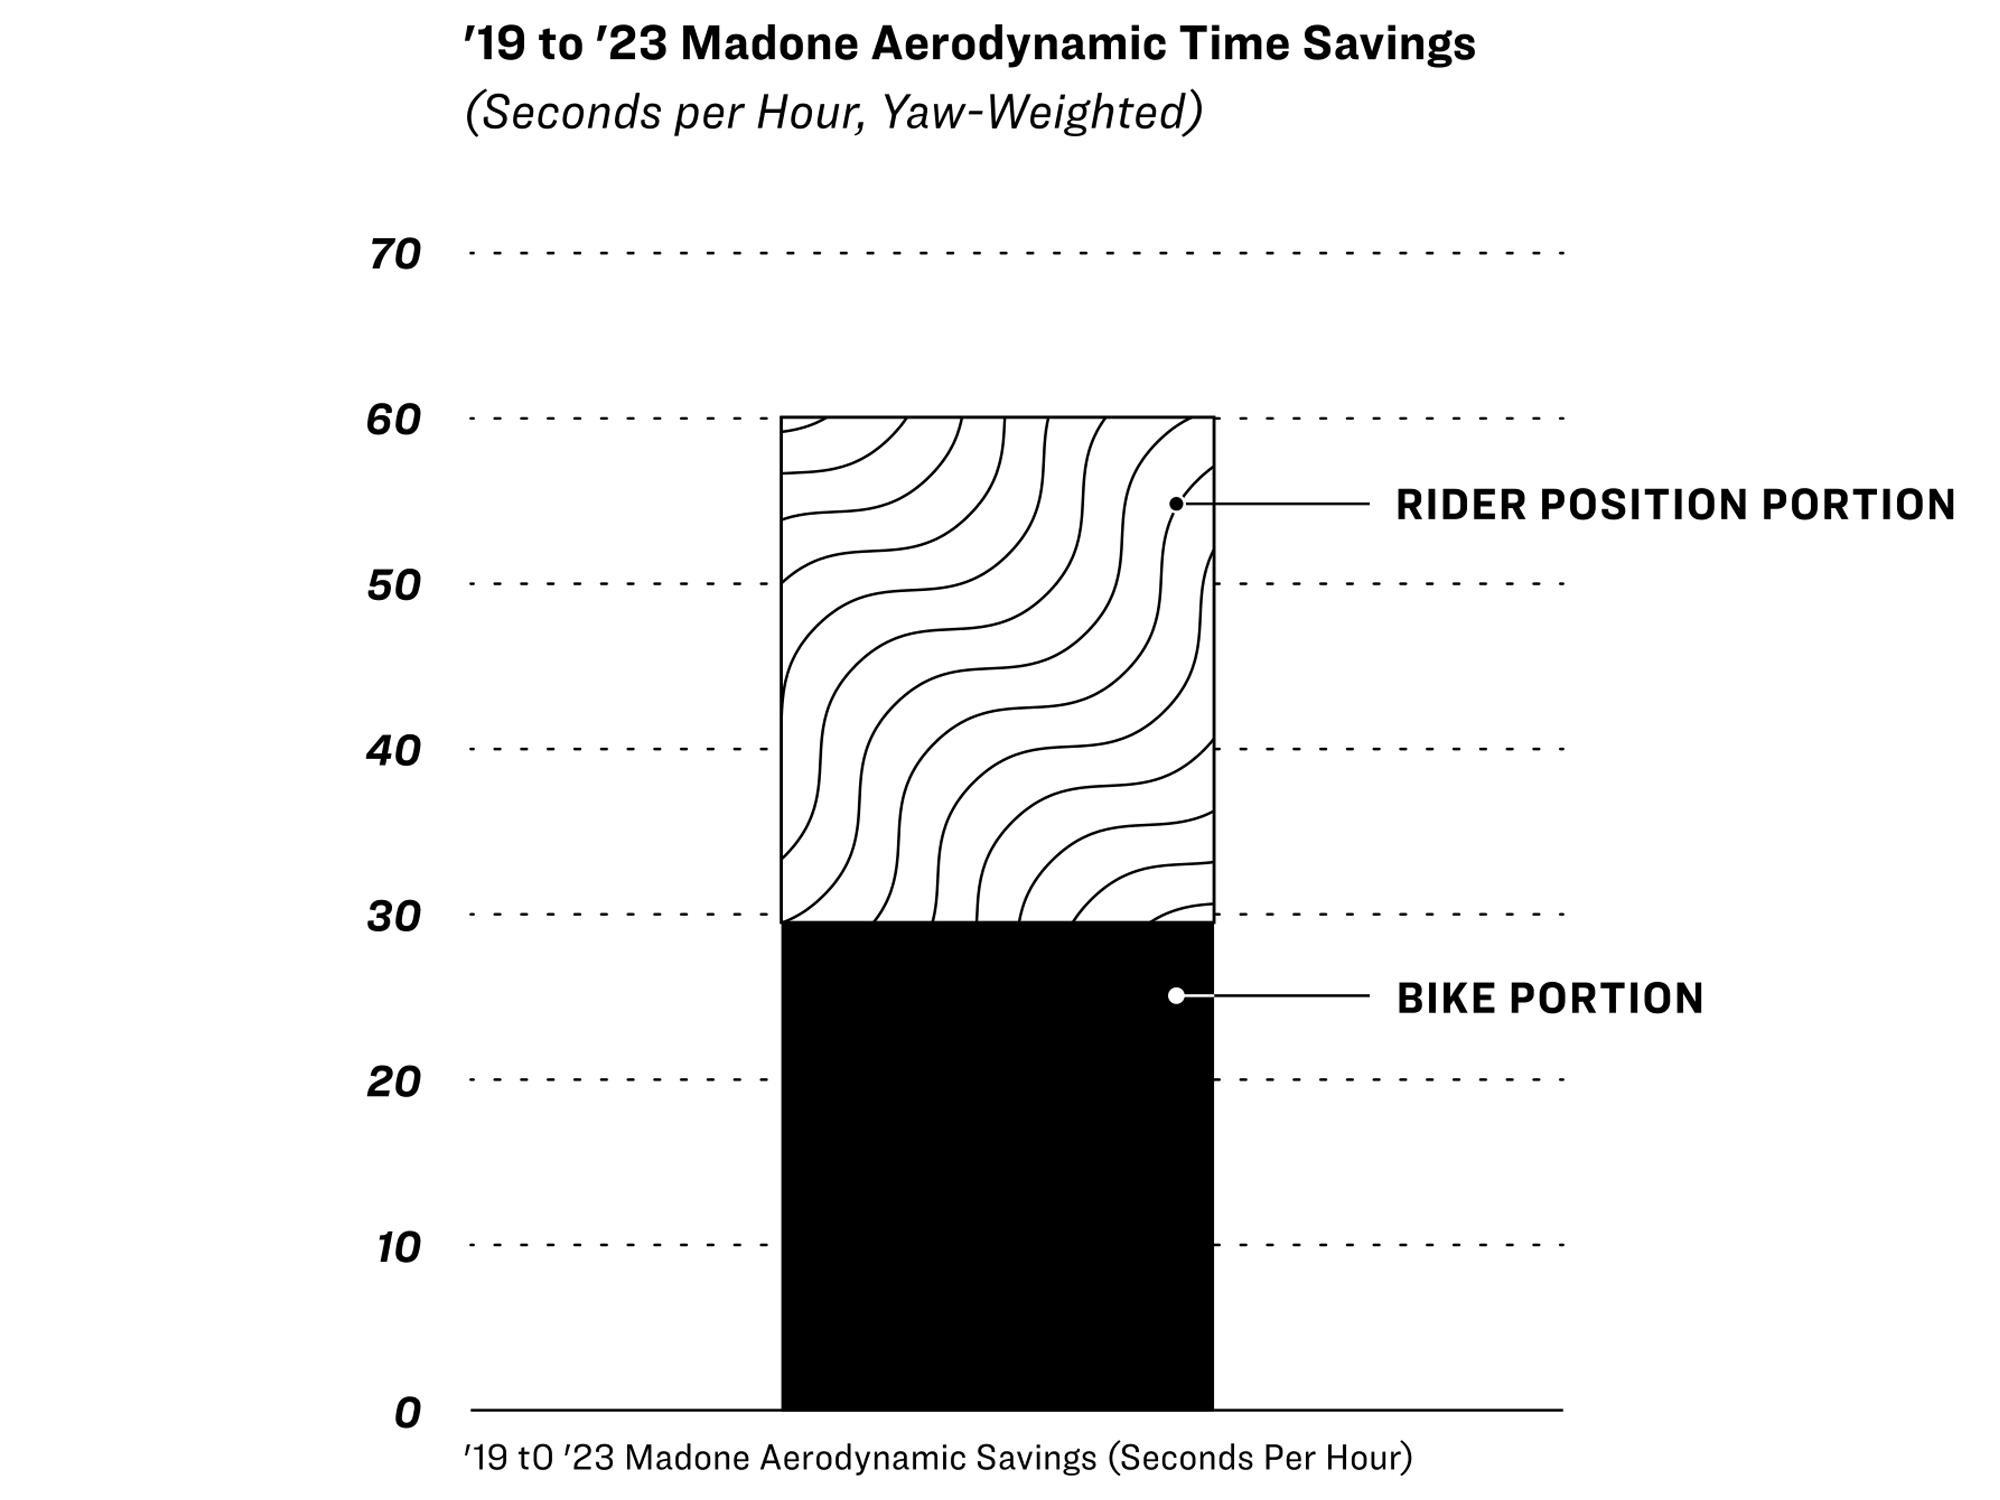
The Madone was designed with our professional race team in mind, but all riders can benefit from these aerodynamic gains. The time savings a rider will see are not as sensitive to riding speed as you might think, since at lower speeds you have more time to take advantage of the aerodynamic benefit.
And for the pro riders who need to contend with ever-increasing race speeds, the new Madone is a crucial addition to the suite of aerodynamic advancements at their disposal. With these wind tunnel results, at the average Spring Monument speeds of today, the new Madone SLR and its aero handlebar position could help a rider switching from the old Madone increase their speed another 0.7 km/h. That’s almost half of the total increase in race speed since the original Madone in 2003, and a true evolution in aerodynamics.
About the author
John Davis is the Aerodynamics Lead at Trek Bicycle. He holds a bachelor’s degree in Mechanical and Aerospace Engineering from Princeton University and a master’s degree in Aerospace Engineering from Georgia Tech.

About the Author: Trek Performance Research
Trek may have been born in a barn, but it was raised on rocket science. Trek Performance Research is the driving R&D force behind developing the industry’s most innovative products.

