- Innovation
- 12 July, 2022
- Trek Performance Research
Good sounds. Bad sounds. The science behind Fuel EXe's game-changing acoustics
We ride with all of our senses, and the way your bike sounds has a surprising impact on your ride experience. To date, electric bike assistance has come with an acoustical cost that we have all learned to live with.
That is, until Fuel EXe.
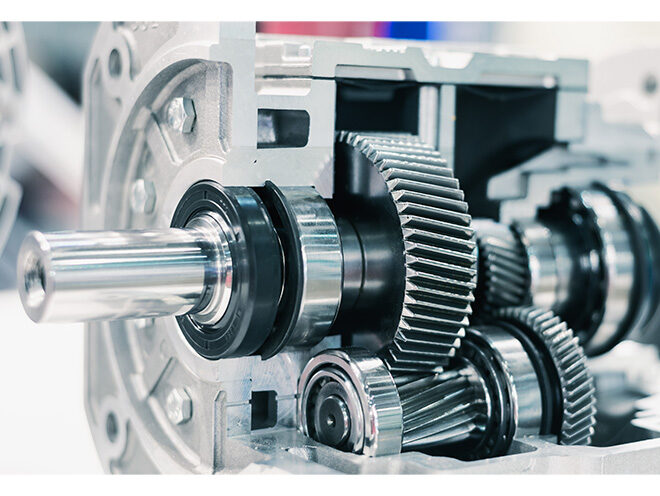
Generic vehicle gearbox with traditional gears. Source: iStock Images / Nordroden
Typical e-bike motors transfer motor power from the motor to the crank through a network of gears, shafts, belts, and/or pulleys. Lots of fast-moving parts meshing together means lots of opportunities for high-pitch unpleasant noise.
In contrast, the Fuel EXe’s harmonic pin ring motor has just single gear interface where load is quietly shared across many of teeth at all times.

In this article, we’ll take you on a scientific journey in bicycle acoustics. It’s a whole new category of bicycle performance that probably matters to you a lot more than you think.
In the end, we’ll show that Fuel EXe sounds 5x more pleasant and 1.8x quieter than other popular e-MTBs. In fact, Fuel EXe sounds much closer to a traditional unassisted bike, bringing you back to the way riding was meant to be.
Skeptical? Before we get into the details, let’s listen to some quick samples of Fuel EXe compared to two popular e-MTBs out on the trail. Finally an e-bike that’s easy on the ears!
Your amazing ears
Hearing is perhaps your most powerful sense, and using microphones to match your hearing entails some pretty extreme science.
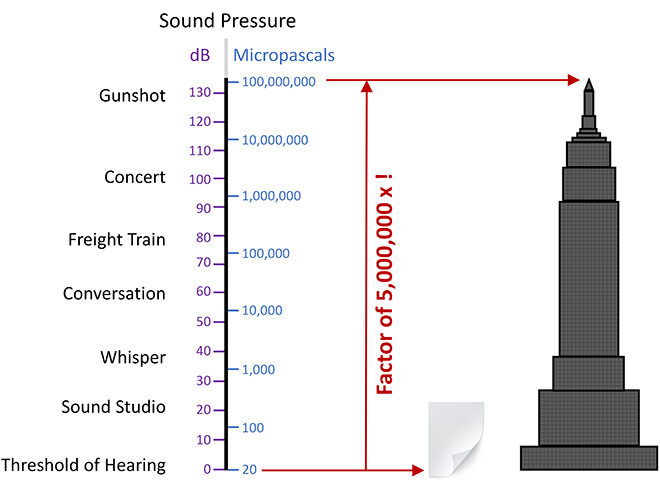
Your ears can detect sound pressure amplitudes ranging from 20 to 100,000,000+ micropascals – an absolutely massive range. That’s like having a single ruler that can measure anything from the thickness of a sheet of paper up to the height of a 100-story building! To accommodate this huge range, we typically talk about sound in the logarithmic scale of decibels (dB).
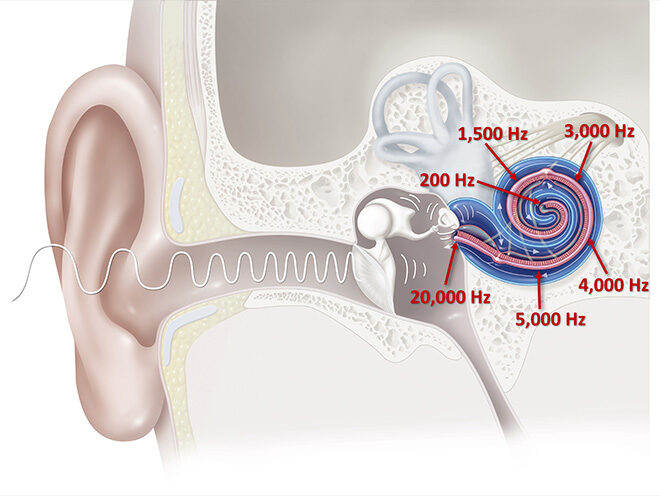
Source: Getty Images / BSIP
Your ears can also detect sound frequencies from 20 to 20,000 Hz – another huge range. The single pressure wave that reaches your ear contains a combination of all these frequencies from all the sound sources around you. Your ear’s spiral-shaped cochlea separates this combined pressure wave back into the individual frequencies and encodes them as nerve signals. Your ears are truly powerful and fascinating sound sensors!
Psychoacoustics
The nerve signals from your ears are then interpreted by the acoustic analysis supercomputer that is your brain. Just imagine the nearly-miraculous processing power and precision required to separate and pinpoint the 3-dimensional location of multiple sound sources in real-time (called sound localization). Your brain further analyzes the patterns of all these sounds and then assigns meanings, emotions, and associations to them.
Psychoacoustics is the study of how your ear-brain system senses and interprets sound. And various psychoacoustic metrics have been developed to convert raw microphone data into how you perceive sounds in terms of both quantity (loudness) and quality.
From the IEC 61672 standard.
Perceived loudness
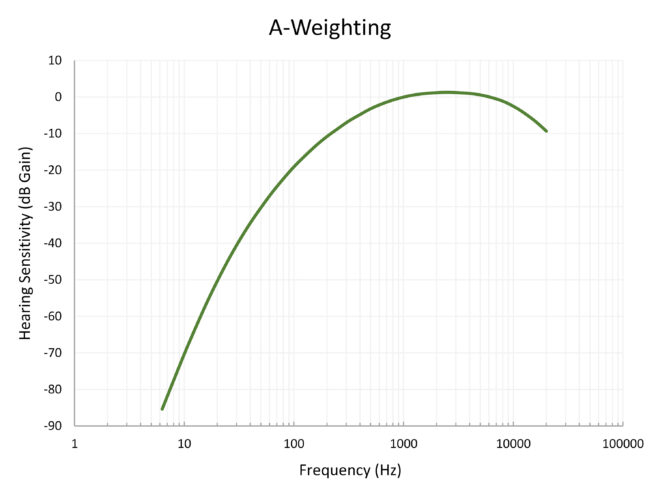
Your hearing sensitivity varies greatly across the frequency range. For example, a 75 dB sound wave at 1,000Hz sounds much louder than a 75dB sound wave at 100 Hz. A common way to account for this varying sensitivity is to apply an A-weighting curve to convert decibels (dB) to A-weighted decibels (dBA). dB defines the physical magnitude of the sound wave, whereas dBA approximates the perceived loudness of that same wave.
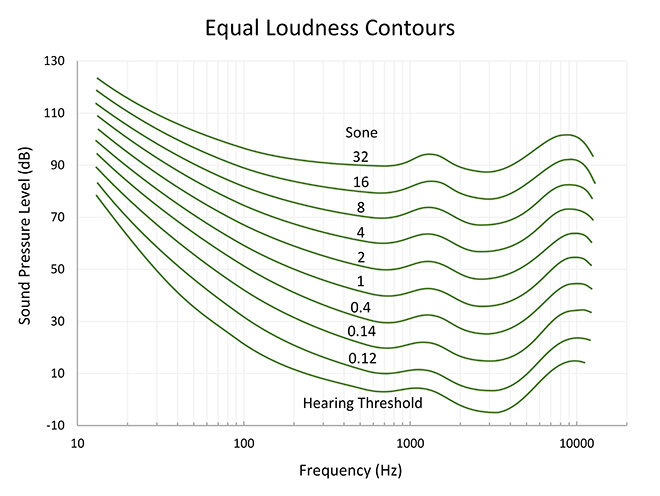
From the ISO 226:2003 standard.
Since the development of the single A-weighting curve, scientists have mapped out a more complete series of “equal loudness contours” that more fully captures the intricacies of your ears. In this graph, any two points along a given line sound equally loud, and each curve is roughly twice as loud as the curve below it. If your ears worked the same as microphones, all of these curves would just be equally spaced horizontal lines.
This chart also introduces the loudness metric sones, which achieves the same purpose as dBA but is more sophisticated and intuitive. Sones scales directly with perceived loudness (2x loudness = 2x sones) whereas dBA is fairly unintuitive (2x loudness = add 10 dB).
Sound quality
Often it is a sound’s quality, rather than its loudness, that dictates your brain’s distinction between good sounds and bad sounds. For example, the high pitch sound of a mosquito is relatively quiet, but it is also quite unpleasant and cuts through the background to grab your attention. Engineers describe this particular type of sound as “tonal,” but our brain can interpret many other sound patterns into categories like rattle, squeal, creak, shrill, rumble, and many more.
Many of these interpretations can be quantified from microphone data using sound quality metrics such as tonality, sharpness, roughness, prominence ratio, fluctuation strength, and articulation index. These metrics can predict your enjoyment using a product, along with your impression of its build quality and performance.

An interesting example in sound quality is the significant engineering effort put into the sound of your car door closing. This sound is secondary to the car’s core function, but it greatly shapes your initial impression of the car’s sturdiness and reliability.
E-Bike psychoacoustics
So how does this all relate to bikes?! Over several years pioneering bicycle psychoacoustics, Trek Performance Research has discovered that your bike’s sound quality – often even more than its loudness – has a big impact on the enjoyment of your ride. For e-MTBs, we have focused on two sound quality metrics – Tonality and Articulation Index.
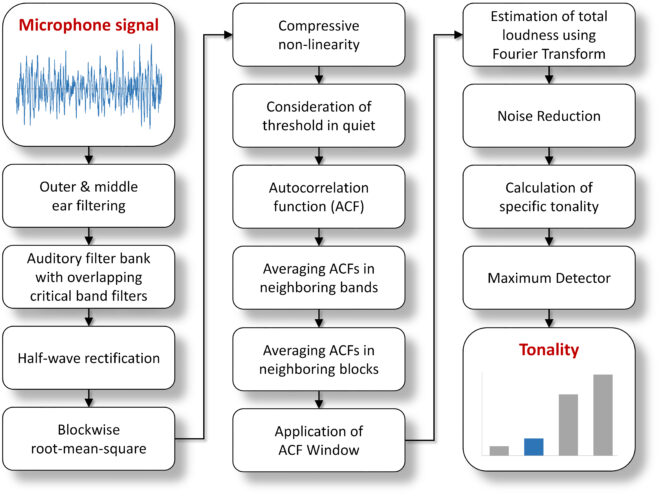
The Tonality HMS calculation uses a complex sequence of 14 algorithms to model your ear-brain system's perception of annoying tones (from the ECMA-74:2019 standard)
Tonality
Electric motors tend to make high pitch tones which can be perceived as especially unpleasant [1, 2]. Just like the example of the mosquito, the whine of an e-bike motor cuts through the background to grab your attention.
Tonality (specifically Tonality HMS) is a modern sound quality metric that uses a series of advanced algorithms to accurately model human perception of these kinds of unpleasant tones. We believe tonality is a key new metric for what riders experience on an e-bike.

Articulation index
A big part of riding with friends and family is the ability to chat, teach each other new skills, and guide each other through new trails. But various sounds on the trail – including your e-bike motor – can block your ability to hear what others are saying. Articulation Index is a sound quality metric that predicts the proportion of speech that is audible and is a good indicator of how sounds may detract from the group ride experience.
Tools & knowledge
Psychoacoustics is a challenging new science in cycling, but it makes a big difference to the ride experience. Trek’s development of bicycle psychoacoustic tools & knowledge reflects its commitment to improving the ride experience through science. When added to our well-established vibration capabilities and expertise, Trek Engineering can now measure, understand, and design for everything you feel and hear on the bike.
Fuel EXe psychoacoustics
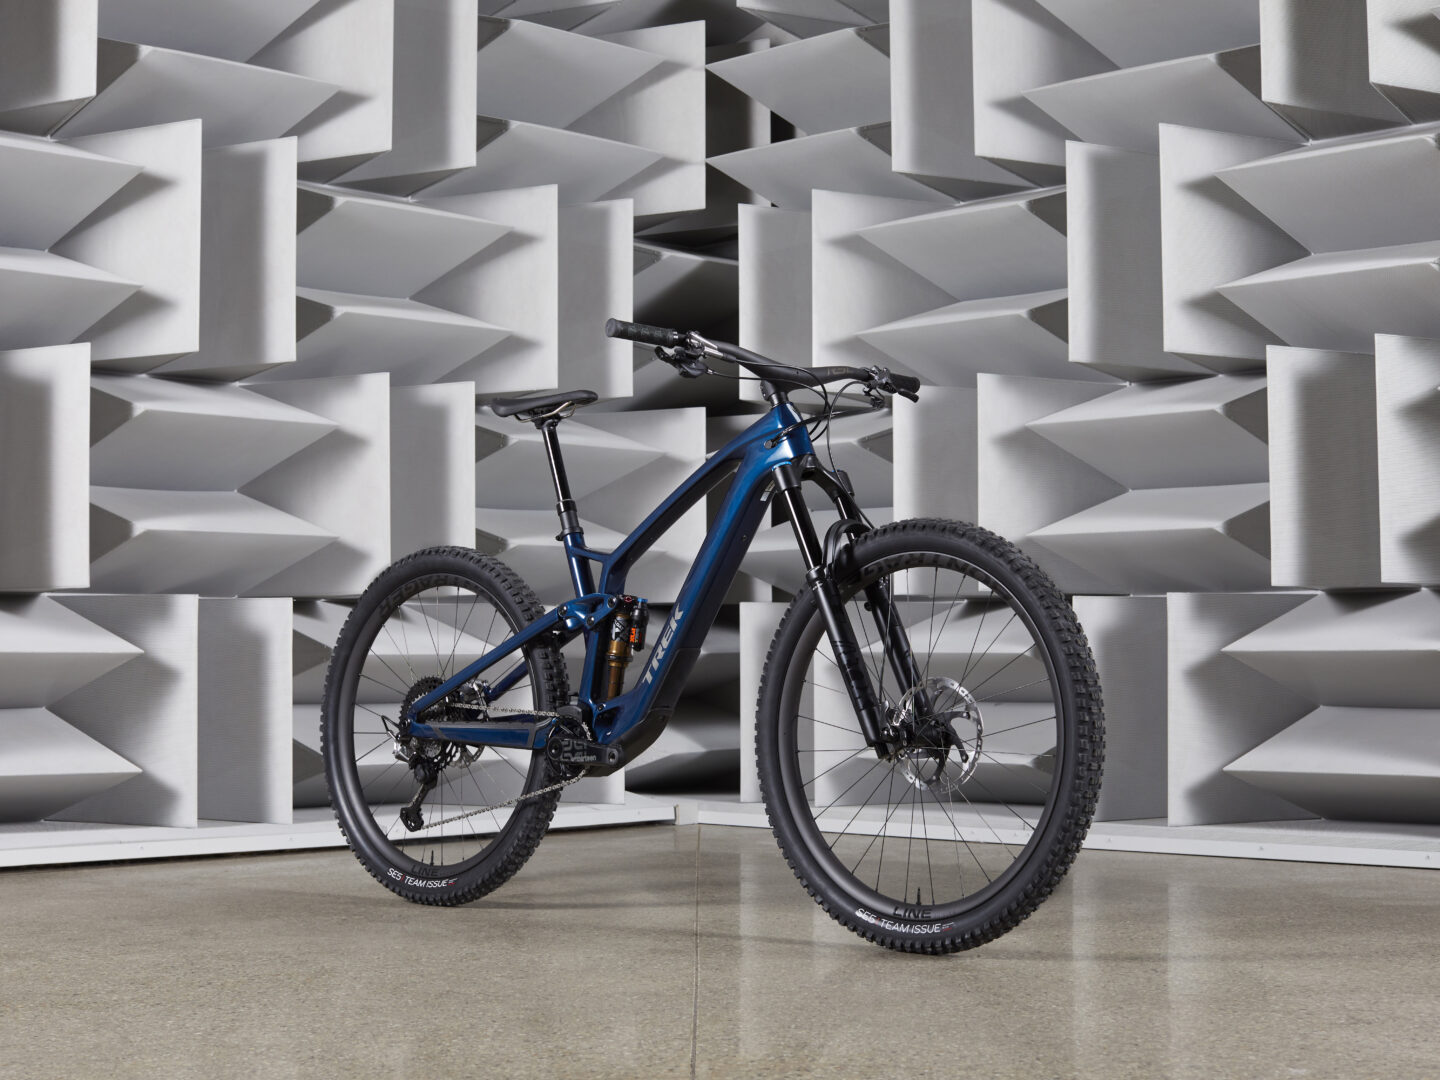
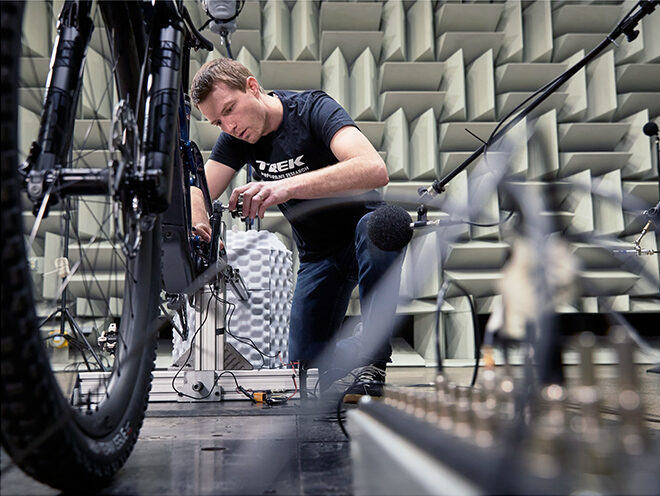
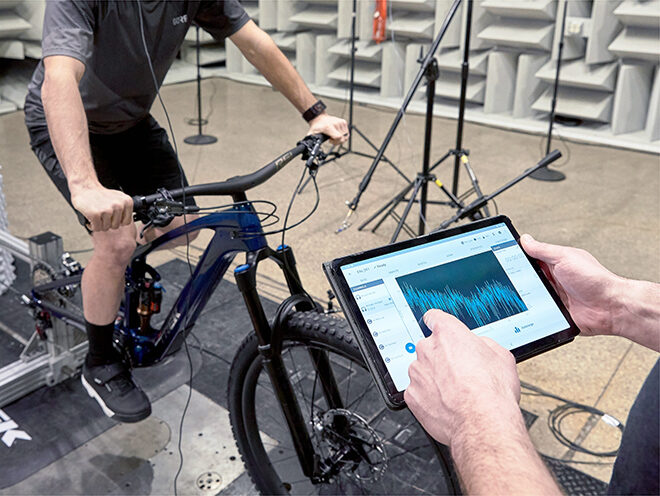
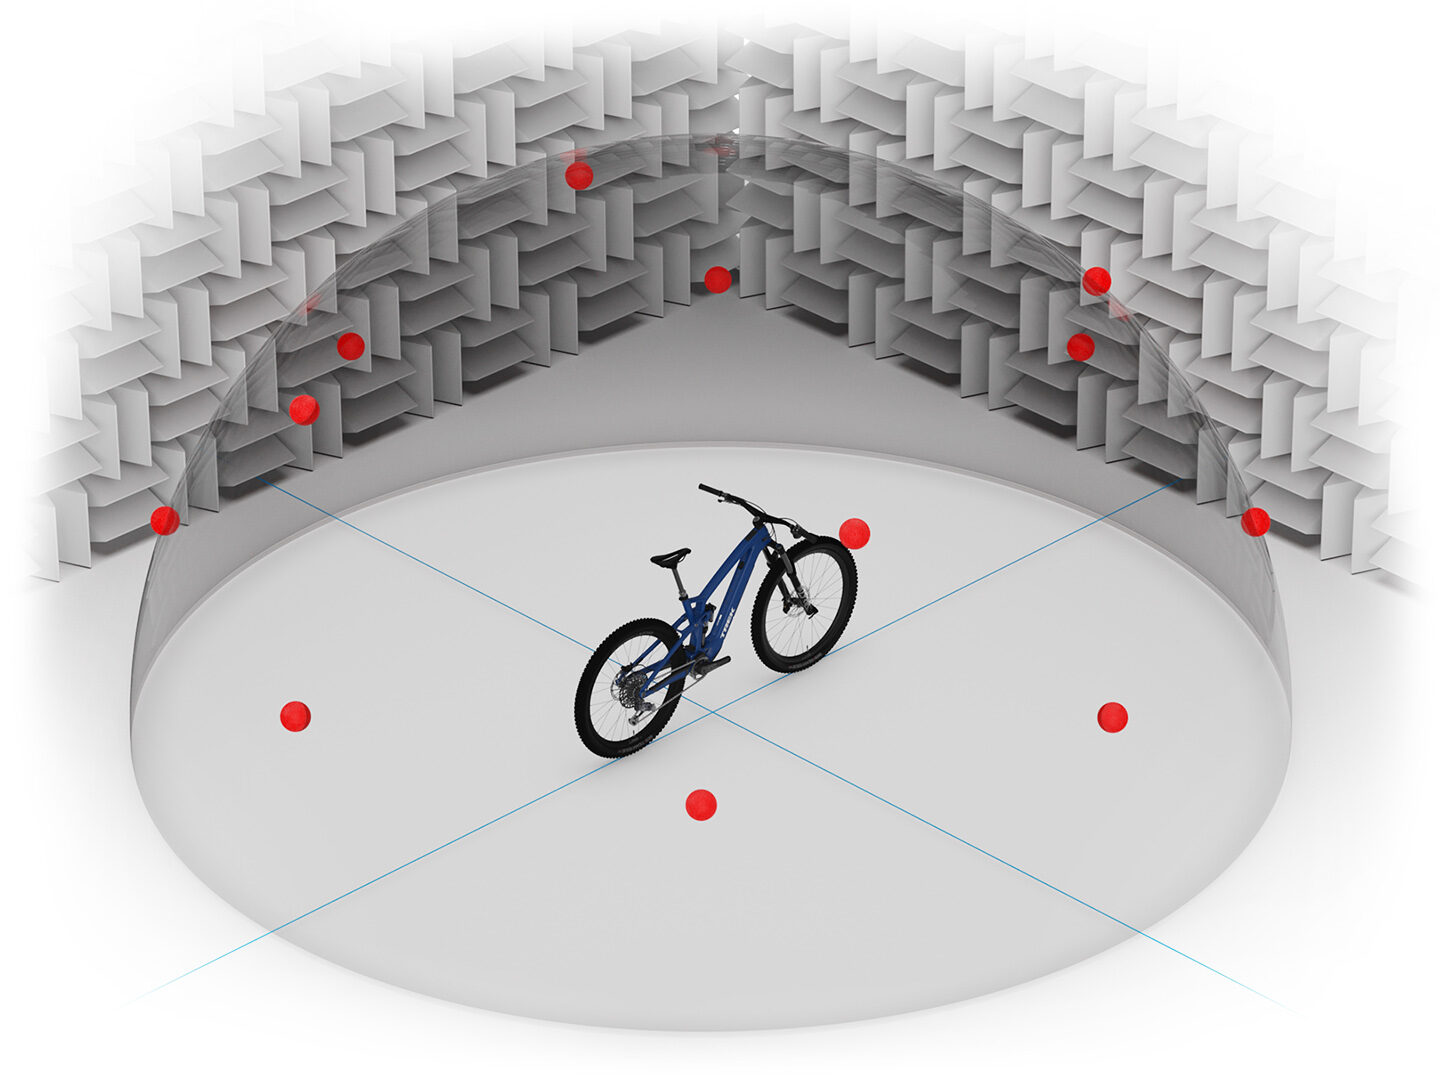
Fuel EXe revolutionizes how quiet and pleasant an e-bike can sound – a fact that we can illustrate using advanced psychoacoustic testing & analysis techniques that were developed throughout the bike’s prototyping phase. The culmination of this testing was a final production bike shootout in the most controlled sound environment possible – an anechoic chamber.
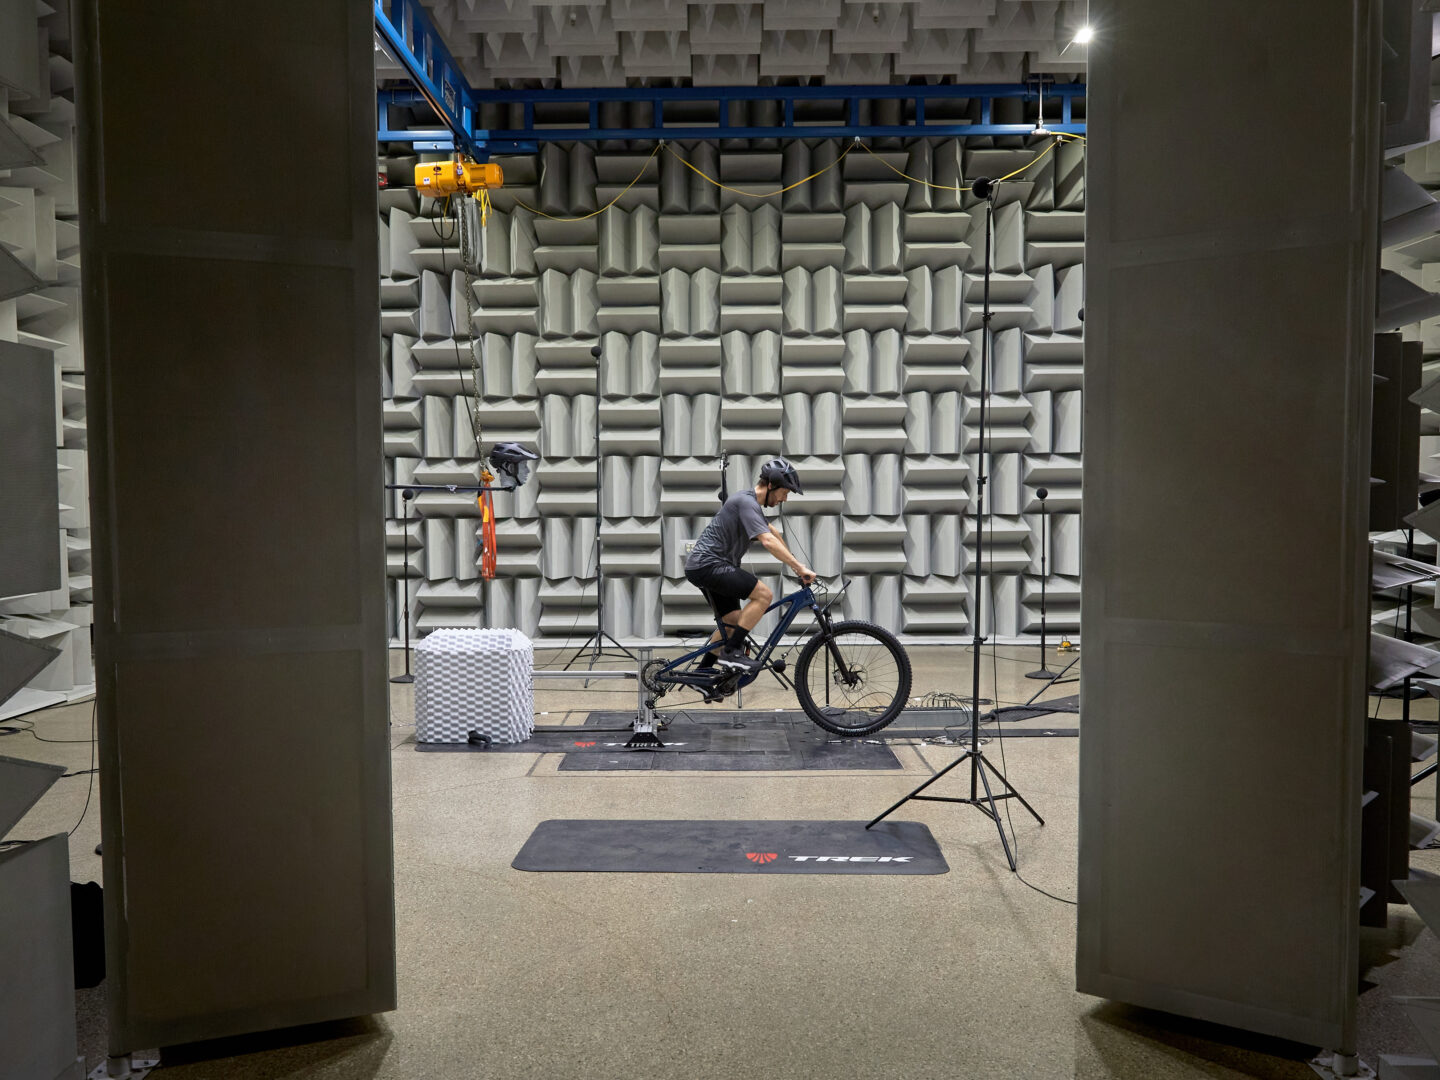
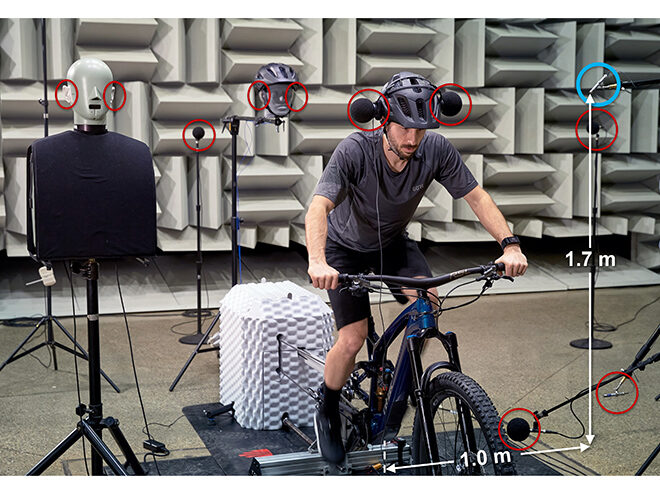
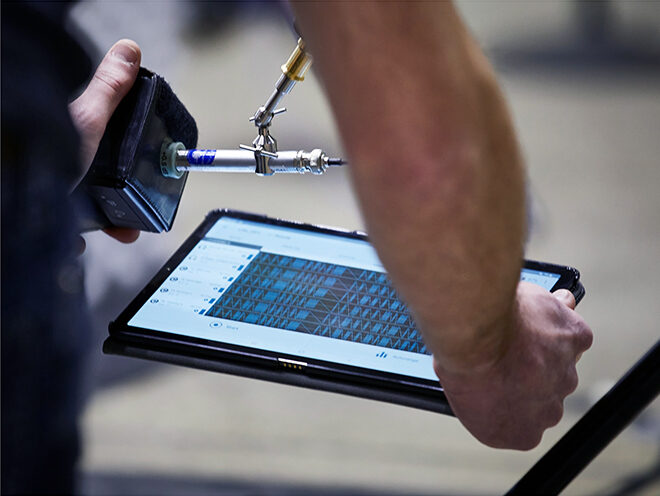
In the anechoic chamber, we compared Fuel EXe to a traditional unassisted bike, a popular light-assist e-MTB, and a popular high-powered e-MTB across a wide range of conditions on a custom sound-isolated trainer fixture. Over the course of two days, we collected 225 million data points using 21 microphones and a cadence sensor that allowed us to relate sound frequency to motor speed.
In these tests, we analyzed the bikes’ tonality, loudness, sound power and articulation index over a cadence range of 40–100 rpm, at total power of 300W, and in the two highest motor assist levels. All charts are based on a B&K 4966-H-041 microphone located 1 m laterally from the bike and 1.7 m vertically from the floor (at head height, circled blue.)
Fuel EXe tonality
Below we see the results for tonality – our key metric for e-bike motor noise perception. The left graph shows tonality over the cadence range, and the right graph averages these results to a single number for each bike.
These tonality graphs show that Fuel EXe is comparable to an unassisted bike and 4-5x more pleasant than other popular e-MTBs. Additionally, Fuel EXe’s tonal noise is barely perceptible, whereas typical e-MTBs are well above the unpleasant threshold.
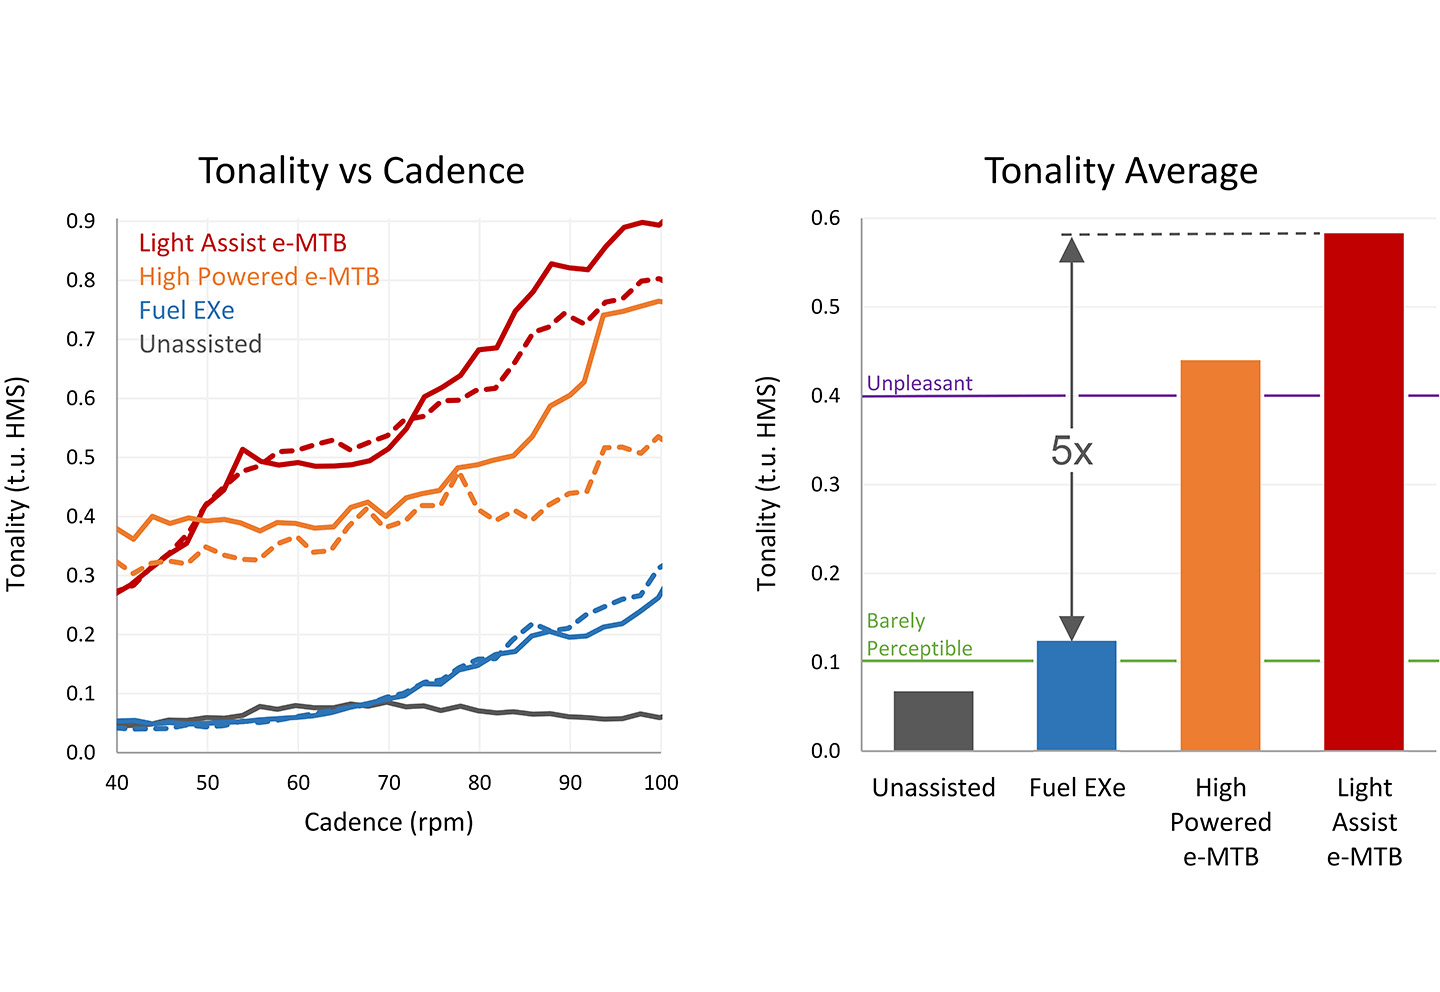
Solid lines are the highest assist mode and dashed lines are the second-highest assist mode. Tonality calculated to the ECMA-74:2019 standard.
“Fuel EXe sounds 4–5x more pleasant than other popular e-MTBs”
Sound samples
Not a big fan of graphs? Listen for yourself from inside the anechoic chamber!
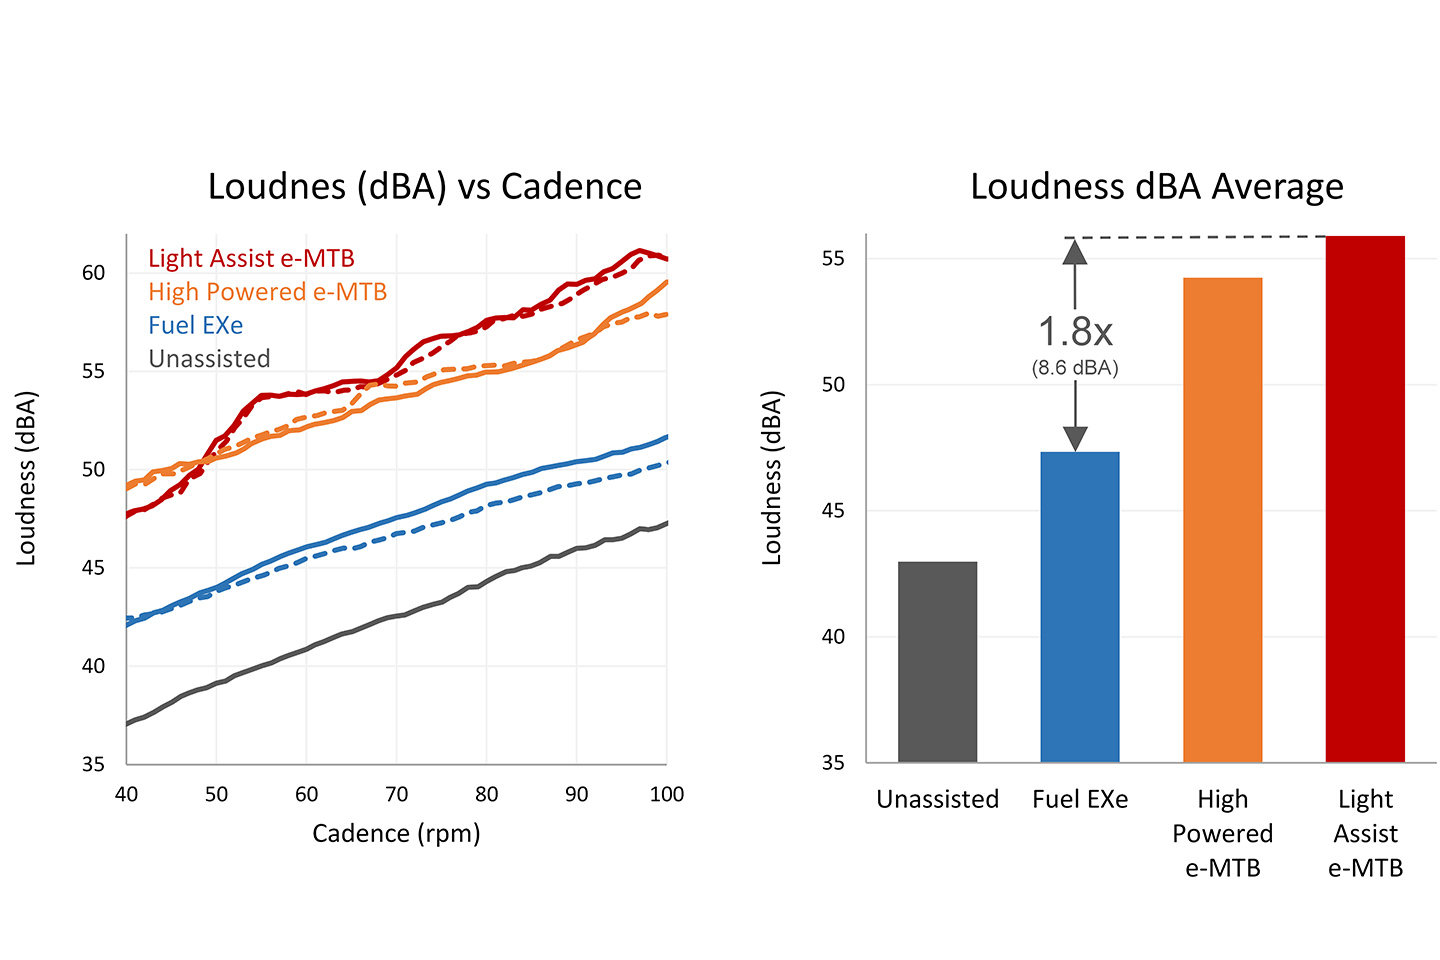
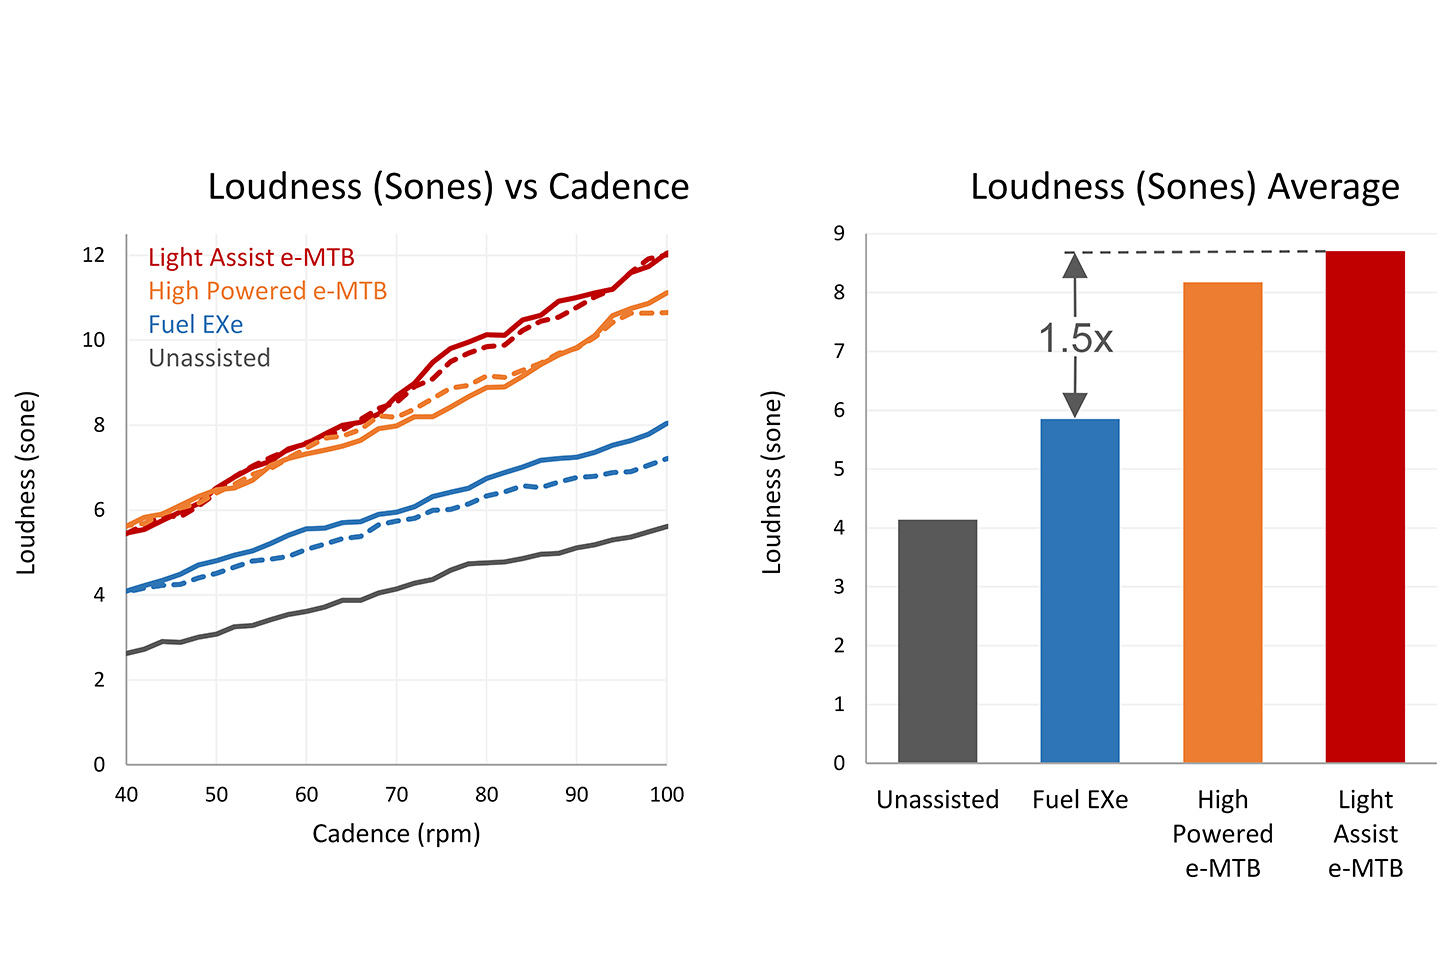
Fuel EXe loudness
While the tonality best relates to your e-bike ride experience, we didn’t forget about loudness. The graphs below show perceived loudness in both dBA and sones. Depending on which combination of bikes and metrics we consider, the EXE is 1.5–1.8x quieter than the other e-bikes and most comparable to unassisted bikes.
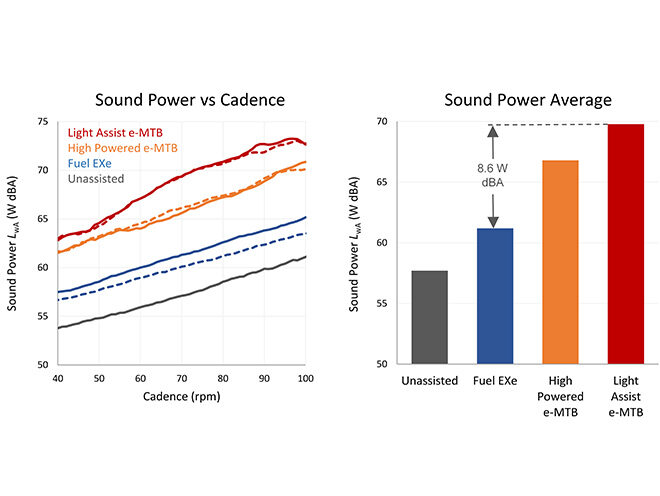
Fuel EXe sound power
Loudness is a key acoustic metric, but it depends on the microphone’s chosen distance direction from the sound source. Our microphone location was chosen to represent the sound at the rider’s or riding partner’s ears, since that’s the location that matters most.
But we additionally took the next step of measuring sound power, which uses a hemispherical array of 12 microphones to quantify the total sound energy emitted from the bike in all directions. In other words, sound power represents how the bikes compare to listeners at any location around the bike.
Sound Power in Watts dBA (ISO3744 standard). Note that sound power is expected to be 15.6 dB higher than loudness, given our loudness microphone's position 1.7 m away from the motor.
Sound Power in Watts dBA (ISO3744 standard). Note that sound power is expected to be 15.6 dB higher than loudness, given our loudness microphone's position 1.7 m away from the motor.
As we see in the graph, sound power ranks very similarly to loudness near the rider’s head. This validates both our loudness results and this chosen location for our single-microphone metrics.
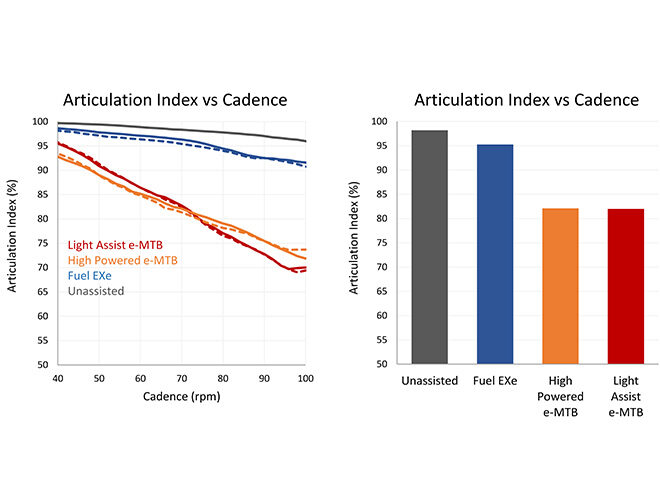
Articulation Index (ANSI S3.5 standard).
Fuel EXe articulation index
As previously discussed, the sound of your bike can interfere with your ability to talk to others while riding. Articulation Index predicts the amount of speech cues can be heard over a given noise. Again, the EXe is much closer to a traditional bike than to other e-bikes and doesn’t get in the way of your conversations out on the trail.
Field tests
While this article focuses on tests from the highly-controlled anechoic chamber, we also took our acoustic test equipment to the trail for validation. The trail results agreed, with Fuel EXe measuring 3-5x lower in tonality and 1.5-1.8x lower in loudness than the other e-MTBs.

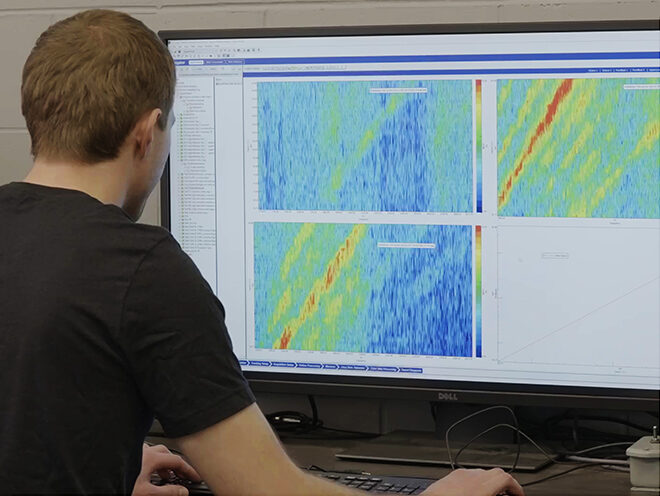
Color map analysis
A very powerful analysis technique is to map loudness as colors across a scale of both cadence and sound frequency. In the color maps below, each diagonal line represents a tone whose frequency (pitch) increases with cadence – these are the tones that cut through the background and grab your attention as unpleasant.
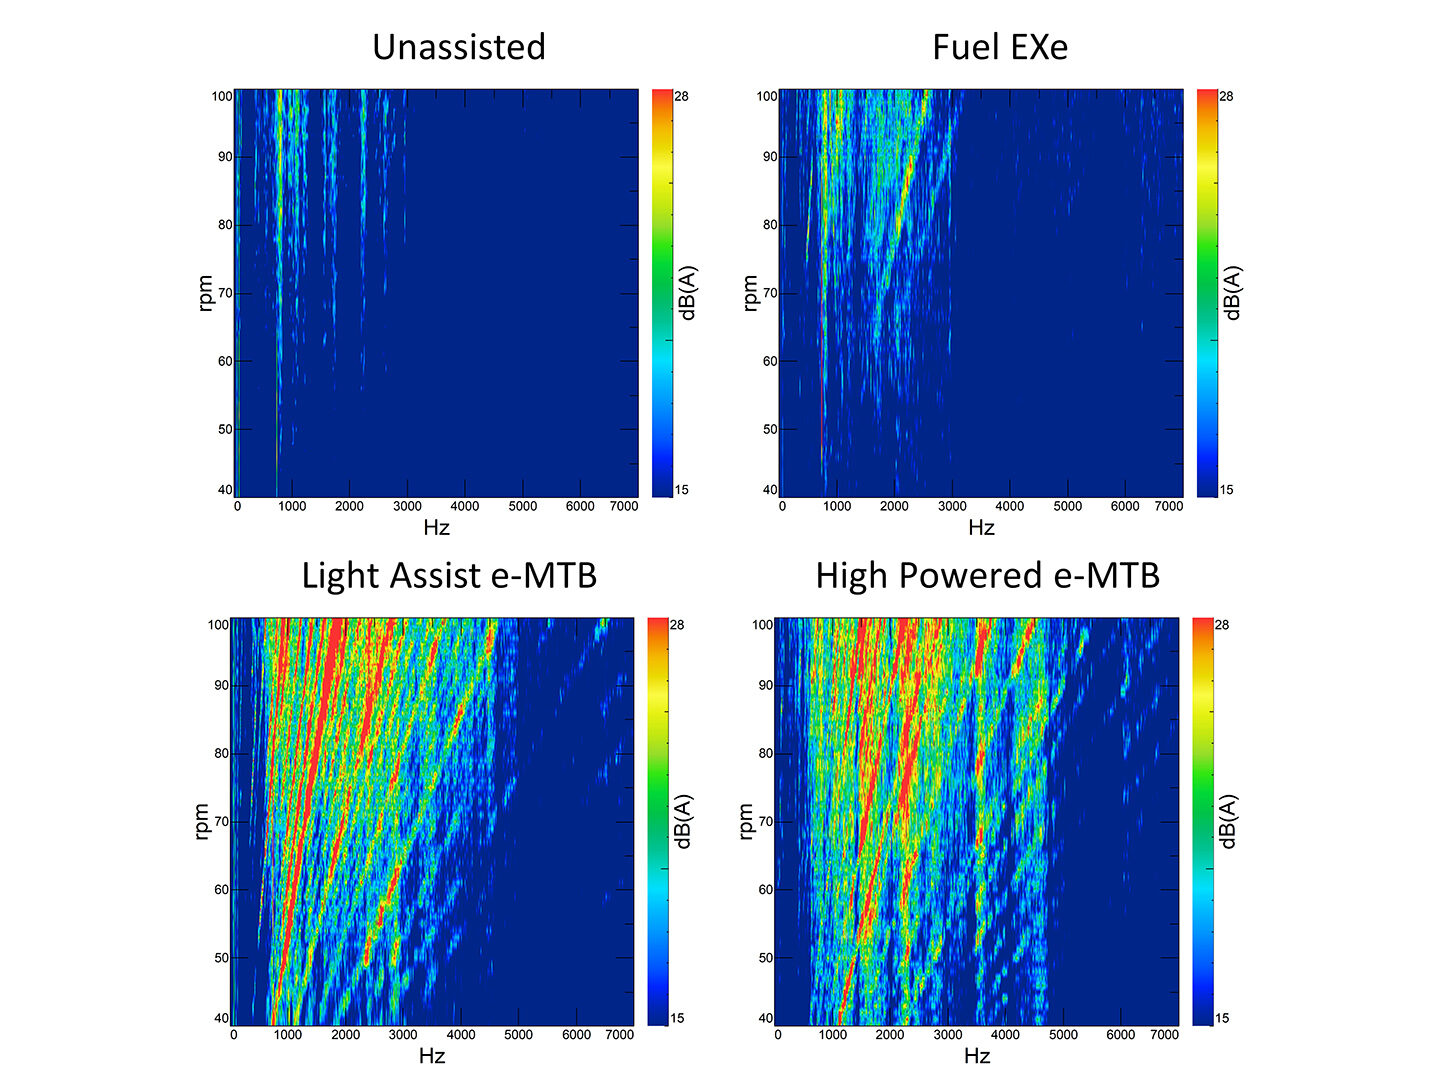
Color maps (highest assist mode).
Each of these diagonal lines correspond to a physical spinning component within the motor, whose gear ratio and tooth/magnet count relates to the slope of the line. Clearly, the traditional e-bike transmissions have a lot of moving parts which create a lot of tones, whereas the Fuel EXe’s harmonic pin ring gear creates just a single, much quieter tone.
Still skeptical?
Are you still skeptical that that a 5x reduction in acoustic tonality will bring you total zen on the trails? Click the link below to find out where you can check out Fuel EXe in person!
About the author
Paul Harder is a Principal R&D Engineer at Trek Bicycle. Since earning an MS in Mechanical Engineering from the University of Wisconsin in 2007, he has dedicated his career to making your ride better through science & innovation.
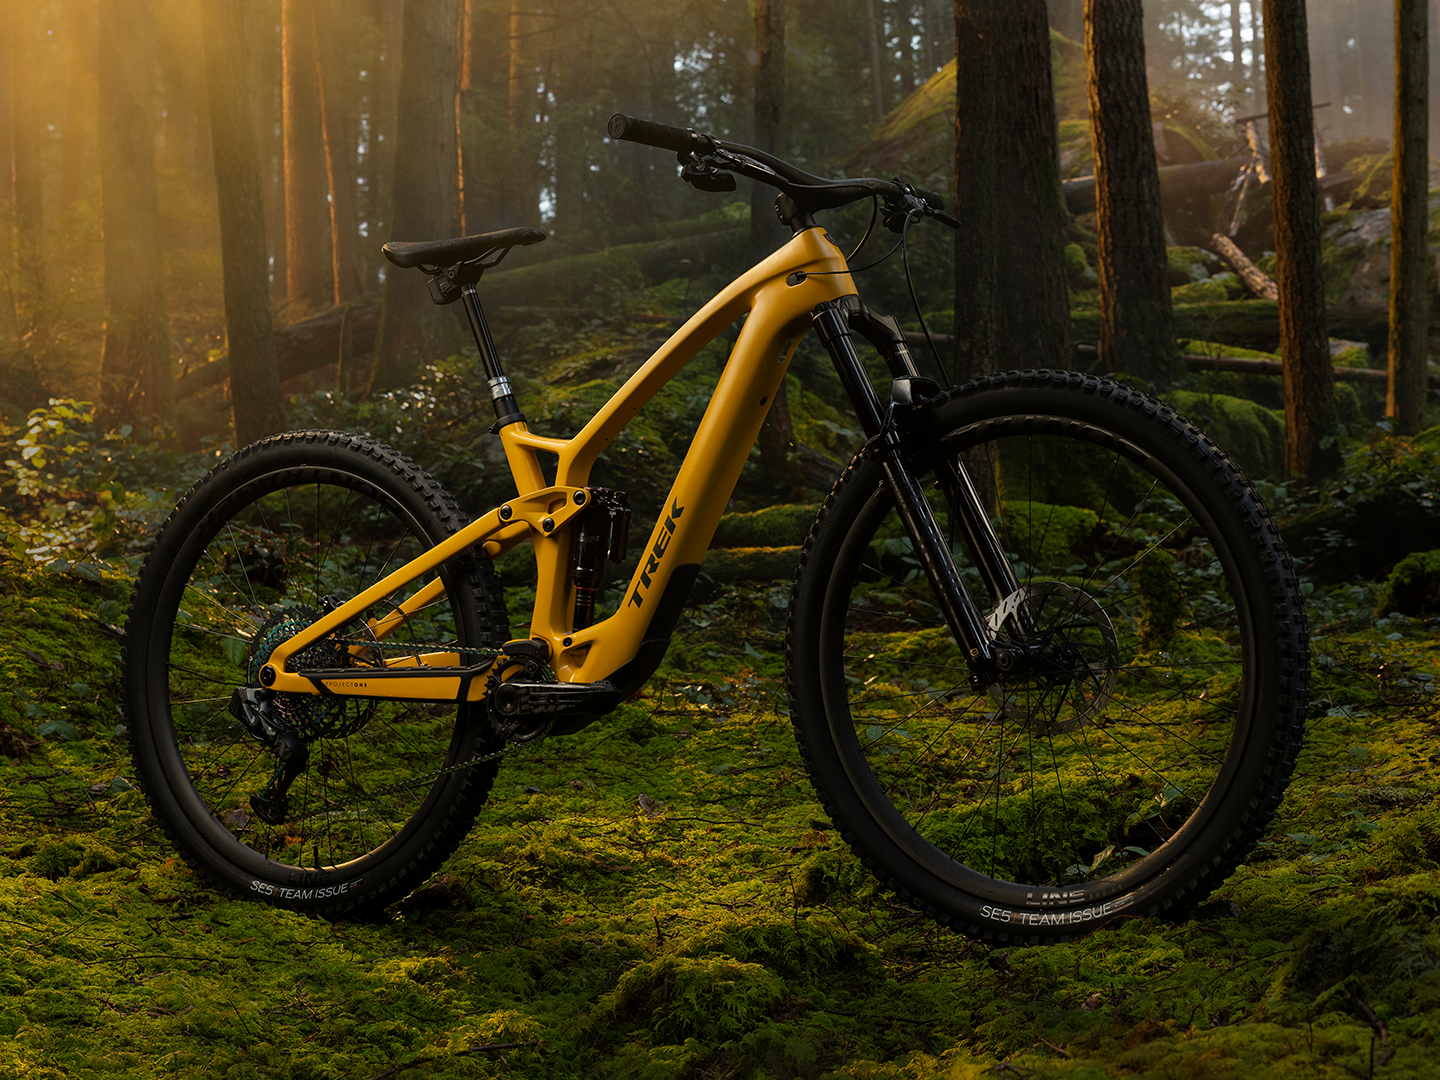
The all-new Fuel EXe
About the Author: Trek Performance Research
Trek may have been born in a barn, but it was raised on rocket science. Trek Performance Research is the driving R&D force behind developing the industry’s most innovative products.